Example of the "Big Picture" Report
Note: This report excludes Administrative incidents, and incidents that have not yet been classified to a test phase.
For 1,233 incidents reported between 06 Dec 2002 and 03 Apr 2005:
1,550 samples were affected, an average of 1.26 samples per incident
Error Rate
Number of errors per 1000 samples = 1.11, assuming a typical volume of 50,000 samples/month x 27.91 months = 1,395,616 samples
This error rate is equivalent to a Sigma Metric of 4.6s
Patient Safety
Patient safety impact was evaluated for 984 (80%) of incidents.
For these incidents, the average severity of patient outcome was 1.31 (1=No Effect, 2=Minor, 3=Severe)
- 1,149 (93%) of incidents were potentially serious adverse events (near misses)
- 489 (40%) caused specimen to be redrawn
- 1,052 (85%) caused a delay in reporting results
- 360 (29%) caused incorrect results to be reported
- Lab was responsible for 693 (56%) of incidents
- 500 (72%) of incidents for which lab was responsible were preventable
- 211 (30%) of incidents for which lab was responsible were cognitive (mistakes that involve misinterpretation of results, or faulty decision-making by the technologist)
The top 3 problems were:
- Primary specimen or aliquot mislabeled or unlabeled - 576 (47%)
- Requisition incorrect - 189 (15%)
- Wrong patient ordered or drawn - 98 (8%)
Distribution of Incidents by Test Phase
06 Dec 2002 to 03 Apr 2005
|
Test Phase |
Count |
Percent |
|
|
Pre-analytic |
1,093 |
88.6% |
ggggggggggggggggggggggg |
|
Analytic |
133 |
10.8% |
gggg |
|
Post-analytic |
7 |
0.6% |
g |
|
Total |
1,233 |
100.0% |
|
Distribution of Incidents for which Lab was Responsible by Laboratory function
06 Dec 2002 to 03 Apr 2005
|
Lab function |
Count |
Percent |
|
|
Processing |
293 |
42.3% |
gggggggggggg |
|
Microbiology |
184 |
26.6% |
gggggggg |
|
Phlebotomy |
113 |
16.3% |
ggggg |
|
Hematology |
48 |
6.9% |
ggg |
|
Chemistry |
44 |
6.3% |
ggg |
|
LIS |
11 |
1.6% |
g |
|
Total |
693 |
100.0% |
|
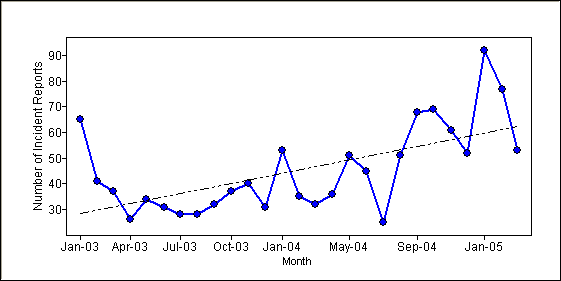
Time Trend
01 Jan 2003 to 01 Apr 2005