Breakdown
The Breakdown report shows the distribution of incident reports by a user-selectable classifier. Controls on the left side of the screen select the classifier, date range, and level of detail:
Distribution of, Group By
These two fields select the classifier to summarize.
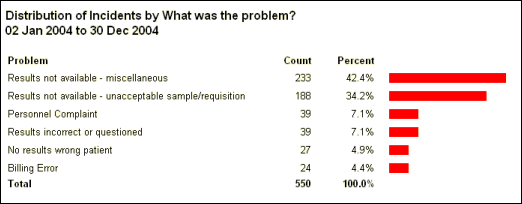
- For a simple breakdown, set Group By to "None". This shows the count and percent of incidents for each value of the Distribution of variable (Example 1 below).
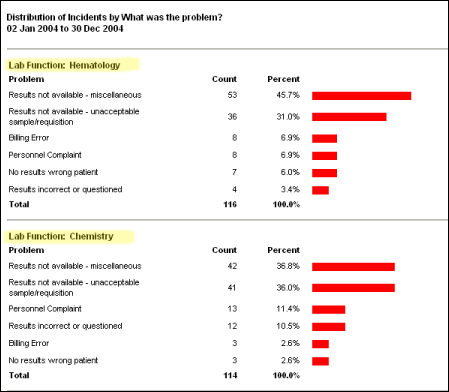
- For a two-level breakdown, such as distribution of problems within each Lab Function, set Group By to outer level and Distribution of to the inner level (Example 2 below)
Date Range
Selects the time period to report. Click Select to enter start and end dates; click All to report all incidents in the database.
Other Criteria
Filter criteria to apply in addition to the Date Range. Example: Show a distribution of problems for the Phlebotomy lab function only. A yellow circle to the right of the button indicates that additional filter conditions are in use.
Items to Show
Lets you focus on the most frequent problems, and suppress detail for the less frequent ones. Suppose there are 20 possible problems. If Items to Show is set to Top 2, the report will show individual percents for the most frequent and second most frequent problem. The other 18 will be lumped together on a single line labeled "Other". Top 5 and Top 10 work in a similar fashion. All, Sort by % shows all items individually, sorted in descending order by percent. All, Alphabetical also shows all items, but sorted in alphabetical order. This is most useful for patient outcomes, since they are displayed in the form "n: description", where "n" is the severity rank.
Click on a line label
Click on a line label to browse the individual incident reports for that line. For example, clicking the text "Billing Error" in Example 1 below, takes you to the Browse screen, showing detailed information about the 24 Billing Error incidents. When you move the mouse cursor over a line label it is highlighted in yellow to remind you that it is clickable.
Distribution of, Group By Examples:
Example 1
Distribution of: Problem, Group By: None
Example 2
Distribution of: Problem, Group By: Lab Function